A brief overview of my contributions to yt-idv this past semester.
My semester working on yt-idv
This past semester I worked on adding a few new features to yt-idv through NCSA’s Student Pushing INnovation (SPIN) internship program. Since I just wrapped up my semester, here’s a quick summary of the largest changes I’ve been working on.
Isocontours
By far the largest feature I was working on this semester was adding isocontours to yt-idv (PR #40). Isocontours serve as a method to view any level set of your data by simply setting some value and tolerance.
We compute these isocontour layers in a fairly simple way. Currently, all of the fragment shaders in yt-idv utilize some form of ray-tracing to determine the colormap output on the screen. Our isocontour shader does the exact same thing, except it searches for the first vertex in any defined isocontour layer (within the range of some set tolerance), and renders that one on the screen. The user can define up to 32 isocontour layers (essentially an unlimited amount) by clicking “Add Layer” and can change the tolerance using the slider when the isocontour shader is selected.
Here are few examples of isocontours in yt-idv in action:
A simple single layer isocontour: this gif shows the process of adding a single isocontour layer at a density value of 10^-24, using one of yt’s sample datasets, IsolatedGalaxy.
Creating isocontours with multiple layers: this gif shows the process of adding and deleting multiple isocontour layers, demonstrated on the ActiveParticleTwoSphere sample dataset.
Spherical Rendering
The other main feature I worked on this semester was spherical rendering in yt-idv (PR #42). Many datasets are natively stored as (r, theta, phi) spherical coordinates rather than as (x, y, z) cartesian coordinates, so it would make sense for yt-idv to support these datasets, letting the user avoid the hassle of converting these datasets to utilize a cartesian coordinate system instead.
The rendering approach here is comprised of two steps. The geometry shader essentially converts the coordinates from spherical to cartesian, splitting up what was once a collection of rectangular subsections of (r, theta, phi) into a collection of wedge-shaped subsections of (x, y, z). These are subsequently passed down to our ray-tracing fragment shader, in which we do our standard ray-tracing regimen (with a few spherical to cartesian adjustments) to render fragments onto the screen.
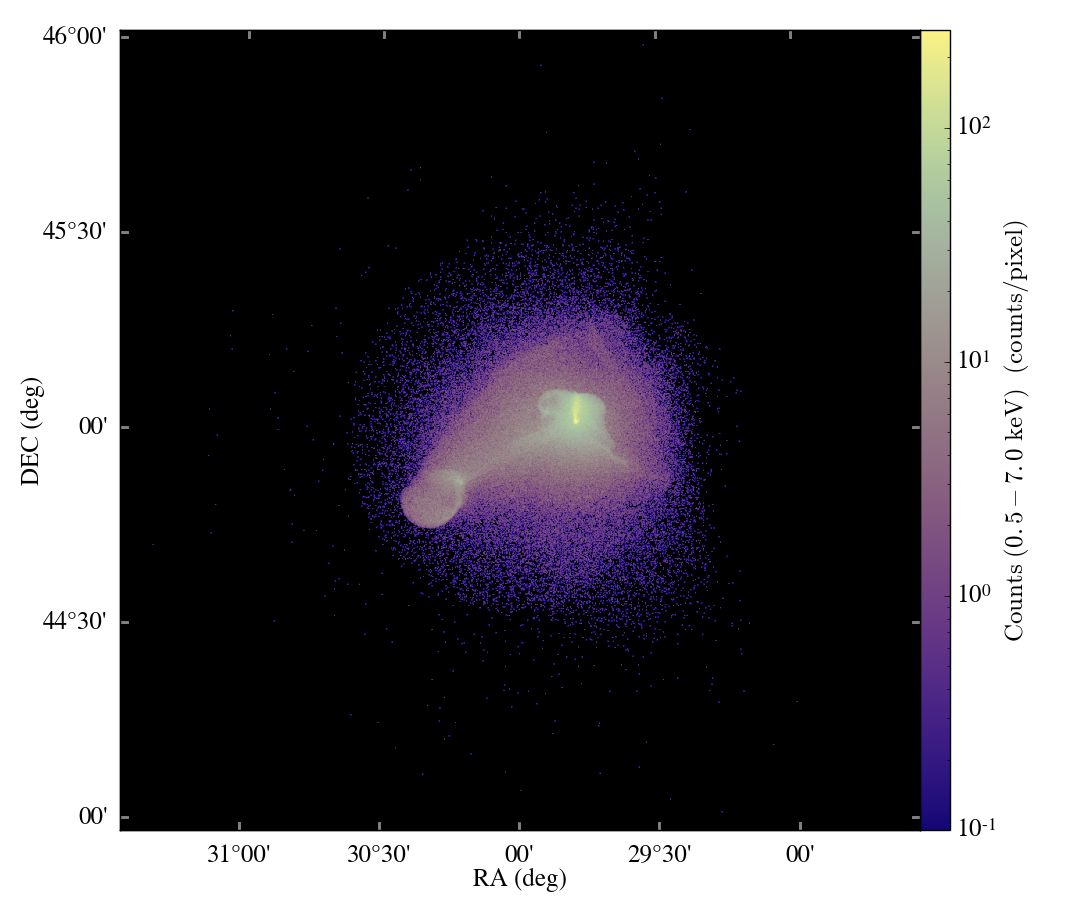
This part isn’t entirely complete, as right now, the shader can only sample one constant value in each block:
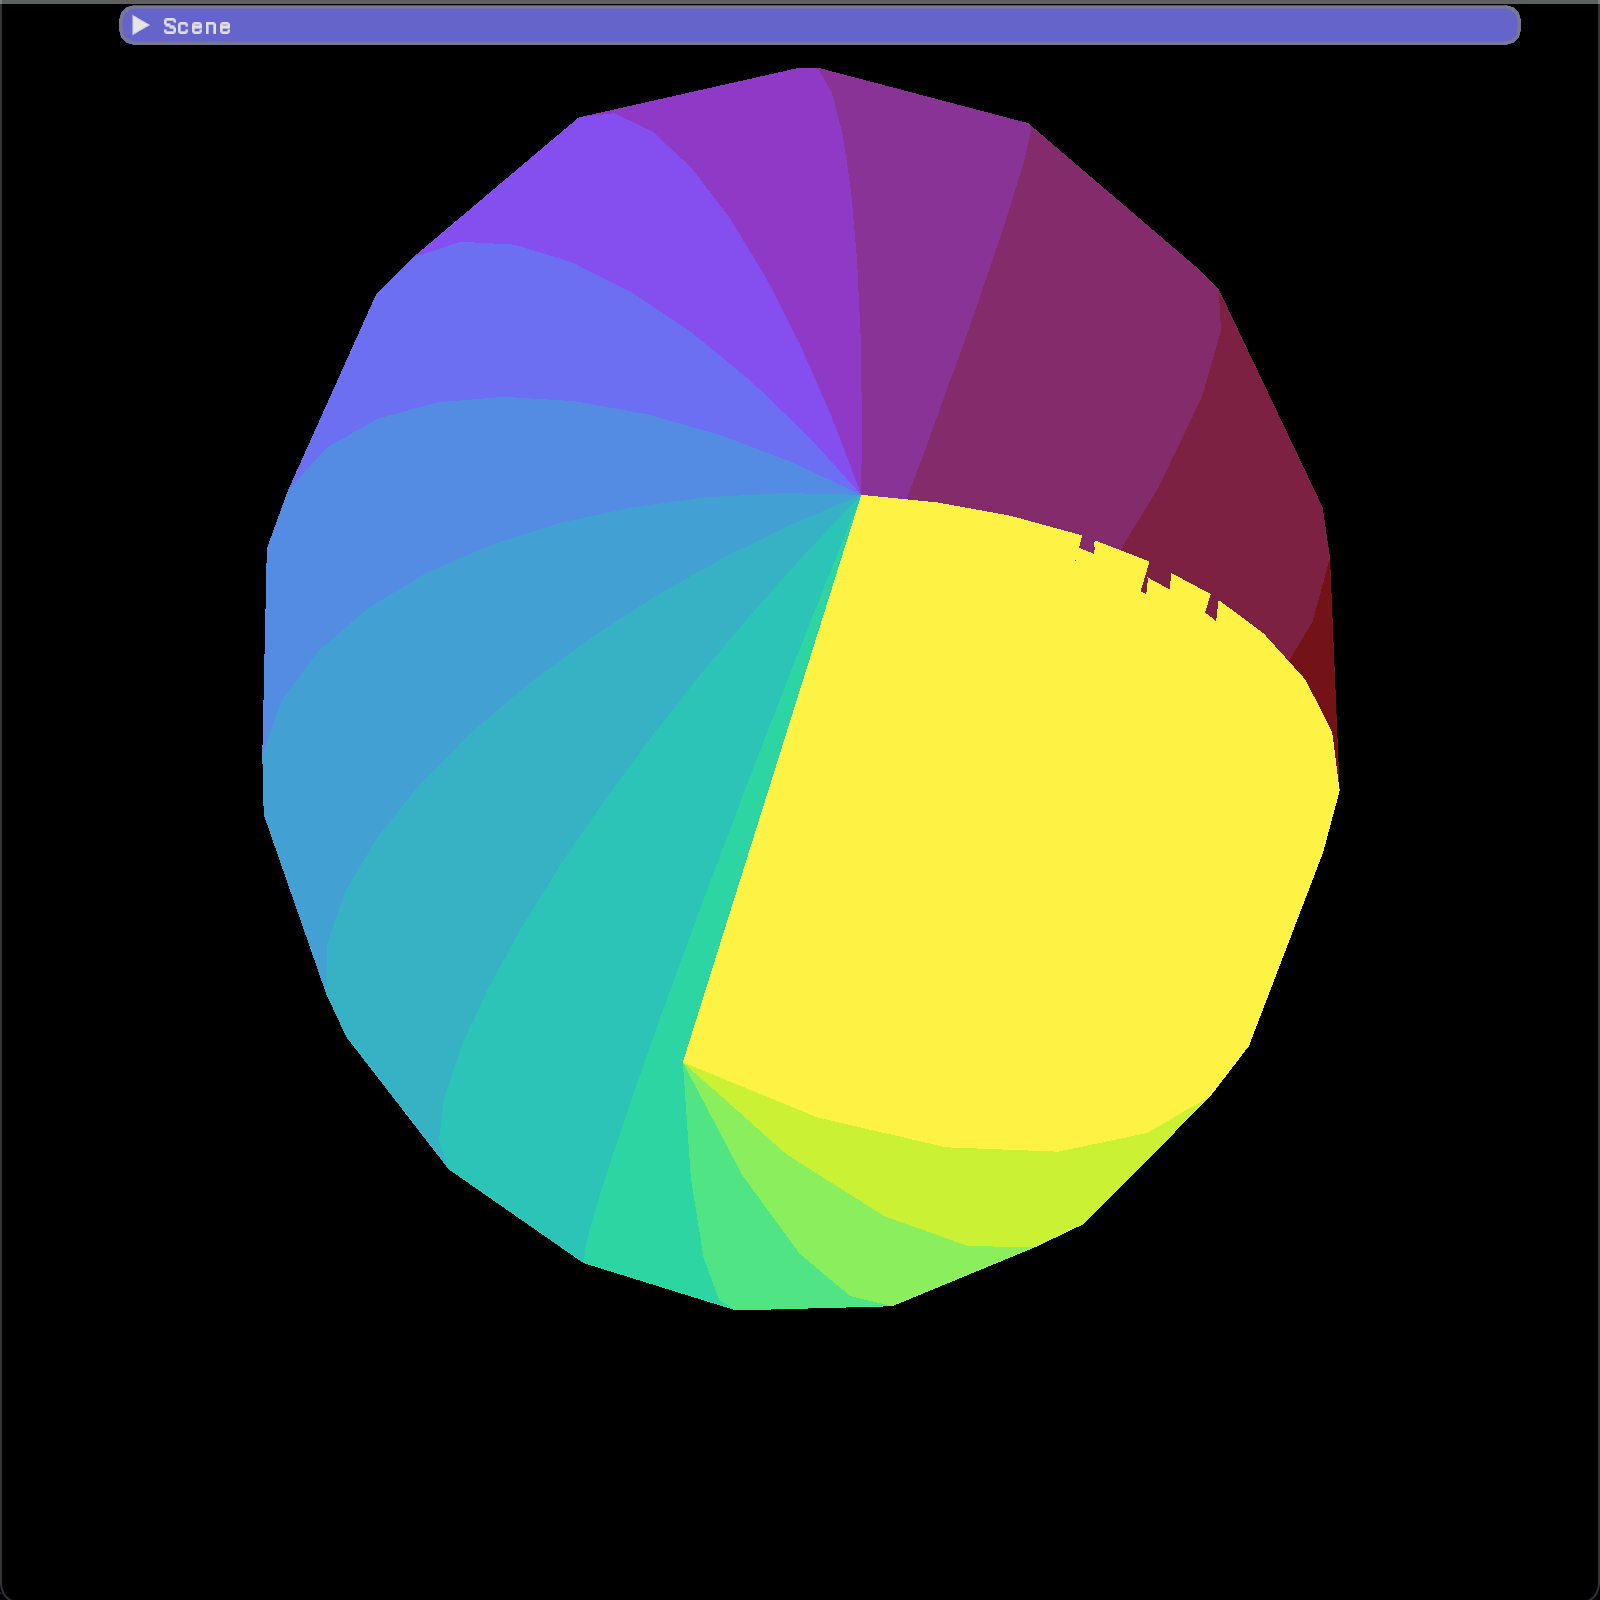
Max intensity projection using spherical rendering, colormap using theta value
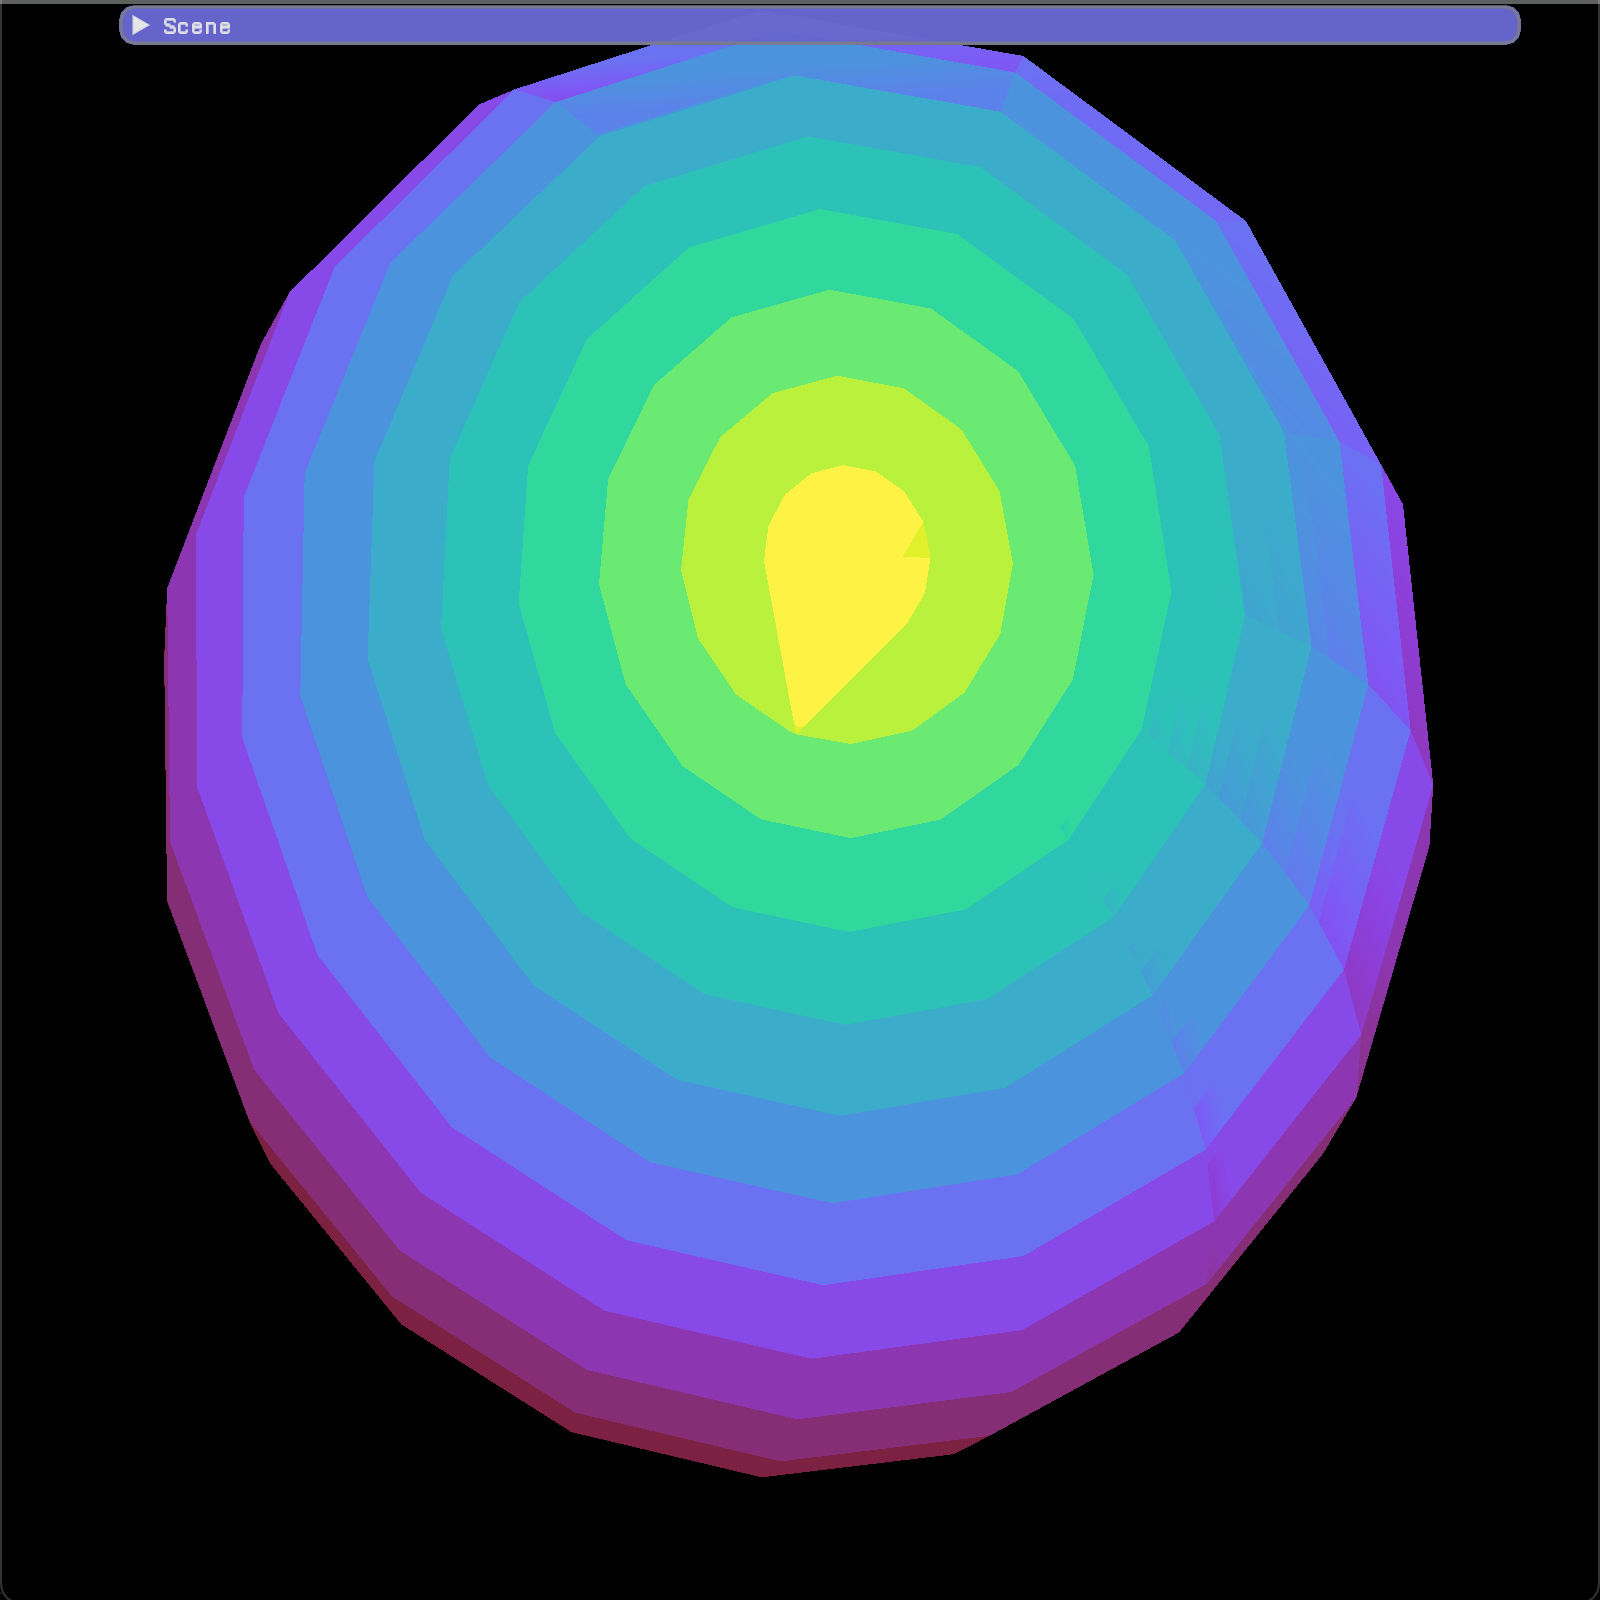
Max intensity projection using spherical rendering, colormap using phi value
Final Thoughts
Overall, I’m very glad I had the opportunity to work on some new features for yt-idv this past semester. It was a really good way to dive deep into OpenGL, and I’m really thankful for the help that Matt and Chris have gave me throughout this past semester. I’m looking forward to working more with OpenGL in the future!