Simple Grid Refinement
@ Matthew Turk | Tuesday, Oct 30, 2012 | 1 minute read | Update at Tuesday, Oct 30, 2012

Notebook Download

Grid refinement

In yt, you can now generate very simple initial conditions:

In[1]:

from yt.mods import *
from yt.frontends.stream.api import load_uniform_grid
from yt.frontends.gdf.api import *
from yt.utilities.grid_data_format.writer import write_to_gdf

class DataModifier(object):
    pass

class TophatSphere(DataModifier):
    def __init__(self, fields, radius, center):
        self.fields = fields
        self.radius = radius
        self.center = center

    def apply(self, grid, container):
        r = ((grid['x'] - self.center[0])**2.0
         +   (grid['y'] - self.center[1])**2.0
         +   (grid['z'] - self.center[2])**2.0)**0.5
        for field in self.fields:
            grid[field][r < self.radius] = self.fields[field]

data = na.random.random((256, 256, 256))
ug = load_uniform_grid({'Density': data}, [256, 256, 256], 1.0)
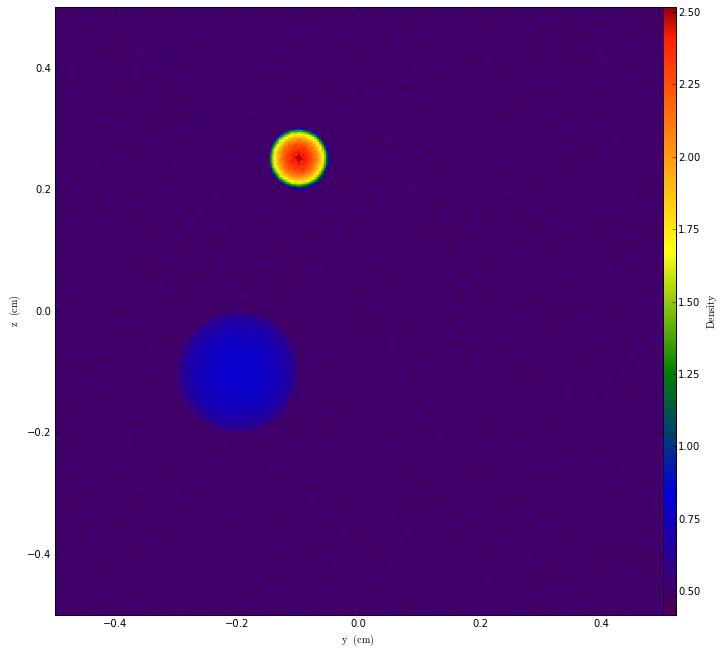
spheres = []
spheres.append(TophatSphere({"Density": 2.0}, 0.1, [0.2,0.3,0.4]))
spheres.append(TophatSphere({"Density": 20.0}, 0.05, [0.7,0.4,0.75]))
for sp in spheres: sp.apply(ug.h.grids[0], ug)
p = ProjectionPlot(ug, "x", "Density")
p.show()

We can even save them out to disk!

write_to_gdf(ug, "/home/mturk/test.gdf")
pf = GDFStaticOutput("/home/mturk/test.gdf")
p2 = ProjectionPlot(pf, "x", "Density")
p2.show()

Over time, this functionality will expand to include cell-flagging, refinement, and much more interesting modifications to grid values.

yt extension modules

yt has many extension packages to help you in your scientific workflow! Check these out, or create your own.

ytini

ytini is set of tools and tutorials for using yt as a tool inside the 3D visual effects software Houdini or a data pre-processor externally to Houdini.

Trident

Trident is a full-featured tool that projects arbitrary sightlines through astrophysical hydrodynamics simulations for generating mock spectral observations of the IGM and CGM.

pyXSIM

pyXSIM is a Python package for simulating X-ray observations from astrophysical sources.

ytree

Analyze merger tree data from multiple sources. It’s yt for merger trees!

yt_idv

yt_idv is a package for interactive volume rendering with yt! It provides interactive visualization using OpenGL for datasets loaded in yt. It is written to provide both scripting and interactive access.

widgyts

widgyts is a jupyter widgets extension for yt, backed by rust/webassembly to allow for browser-based, interactive exploration of data from yt.

yt_astro_analysis

yt_astro_analysis is the yt extension package for astrophysical analysis.

Make your own!!

Finally, check out our development docs on writing your own yt extensions!

Contributing to the Blog

Are you interested in contributing to the yt blog?

Check out our post on contributing to the blog for a guide!

We welcome contributions from all members of the yt community. Feel free to reach out if you need any help.

the yt data hub

The yt hub at https://girder.hub.yt/ has a ton of resources to check out, whether you have yt installed or not.

The collections host all sorts of data that can be loaded with yt. Some have been used in publications, and others are used as sample frontend data for yt. Maybe there’s data from your simulation software?

The rafts host the yt quickstart notebooks, where you can interact with yt in the browser, without needing to install it locally. Check out some of the other rafts too, like the widgyts release notebooks – a demo of the widgyts yt extension pacakge; or the notebooks from the CCA workshop – a user’s workshop on using yt.

Social Links