This week I added the ability to calculate all-sky column densities. This functionality uses HEALpix to calculate equally-area regions on the sky and then shoots out rays from a central source to some fixed radius, accumulating values of a field along the way. Although so far I’ve only used it to calculate column densities of “Density” it could be used for other values as well, including all- sky weighted averages of quantities.
This works via a new HEALpixCamera object, which accepts an Nside argument (the number of pixels is 12*Nside*Nside) as well as a center and a radius. It’s still a bit rough around the edges, but currently it will work to generate projections over the entire sky.
It’s important to note that the difficulties inherent in sorting bricks radially prevent it from being used for transfer functions that involve any absorption. This means that currently it only works with “ProjectionTransferFunction” as an input.
To generate the projected pixels, we have to create a camera and ask it to cast rays along each pixel. This script will do that:
from yt.mods import *
import yt.visualization.volume_rendering.camera as camera
Nside = 32
pf = load('DD0008/galaxy0008')
cam = camera.HEALpixCamera([0.5,0.5,0.5], 0.2, Nside, pf = pf, log_fields = [False])
bitmap = cam.snapshot()
The returned bitmap will, as per usual, be an array of integrated values. Because we’re using the projection transfer function, with the HEALpix camera, it will be an ordered pixel list of shape (12*Nside*Nside, 1, 4) where the first channel is ordered in order of pixels as per the HEALpix notation. We now have to convert this to a regularly gridded set of values, between 0 and 2pi and 0 and pi, for the theta and phi coordinates.
yt provides a helper function to go from pixel ID to angle (as well as a few other things). You can access this helper function in this manner:
import yt.utilities.amr_utils as au
from numpy import pi
phi, theta = na.mgrid[0.0:2*pi:800j, 0:pi:800j]
pixi = au.arr_ang2pix_nest(Nside,
theta.ravel(), phi.ravel())
img = na.log10(bitmap[:,0,0][pixi]).reshape((800,800))
The call to mgrid creates a regularly-spaced mesh of values. We then ask HEALpix what the pixel IDs are that fall into each of these regularly spaced mesh values, and then we apply those pixels in that order. This transformation will, someday, be implicit in the snapshot() call.
At this point we can plot our regularly spaced mesh using one of several projections. We’ll do the Mollweide projection. To do this, we import the appropriate Matplotlib components and plot using the imshow command:
import matplotlib.figure
import matplotlib.backends.backend_agg
fig = matplotlib.figure.Figure((10, 5))
ax = fig.add_subplot(1,1,1,projection='mollweide')
image = ax.imshow(img,
extent=(-pi,pi,-pi/2,pi/2), clip_on=False, aspect=0.5)
cb = fig.colorbar(image, orientation='horizontal')
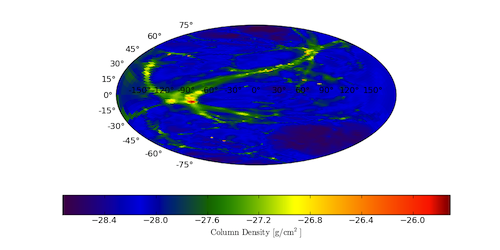
cb.set_label(r'$\mathrm{Column}\/\mathrm{Density}\/[\mathrm{g}/\mathrm{cm}^2]$')
canvas = matplotlib.backends.backend_agg.FigureCanvasAgg(fig)
canvas.print_figure('allsky.png')
As you can see, it’s currently still a bit rough-around-the-edges (the image is below) but it’s on the way to being very useful. In particular, setting Nside higher above should improve the image quality, and adjusting the axis display in matplotlib can remove the latitude and longitude display. There is also currently a bug (which I have reported but not heard back on) in matplotlib related to changing the size of the axes object.
Hopefully soon enough this will be ready to be wrapped more simply into yt, and it can be made available in a more straightforward fashion. For now, paste 1503 includes a full script that will all-sky render and output an image like the one below.