Line Integral Convolution for Vector Field Visualization
@ Suoqing Ji | Thursday, Aug 20, 2015 | 2 minute read | Update at Thursday, Jun 4, 2020

How to visualize a line integral convolution for a vector field with yt

Visualization of Vector Fields

When I was working on my first publication with Prof. Robert Fisher, we explored several ways to visualize the magnetic field in our simulations of white dwarf binary merger. Finally we drew magnetic field in the form of streamlines, which did a satisfactory job. However, since the streamlines could not be arbitrarily dense, the magnetic field geometry was not spatially continuous and the information near pixel scale was lost.

Until recently, I got to know the method of line integral convolution (LIC) and adapted the SciPy cookbook example to yt. The basic idea of LIC is to convolute vector field orientation with local texture over a certain kernel length, thus all the details of vector field geometry can be preserved.

Draw LIC with ONE Line of Code

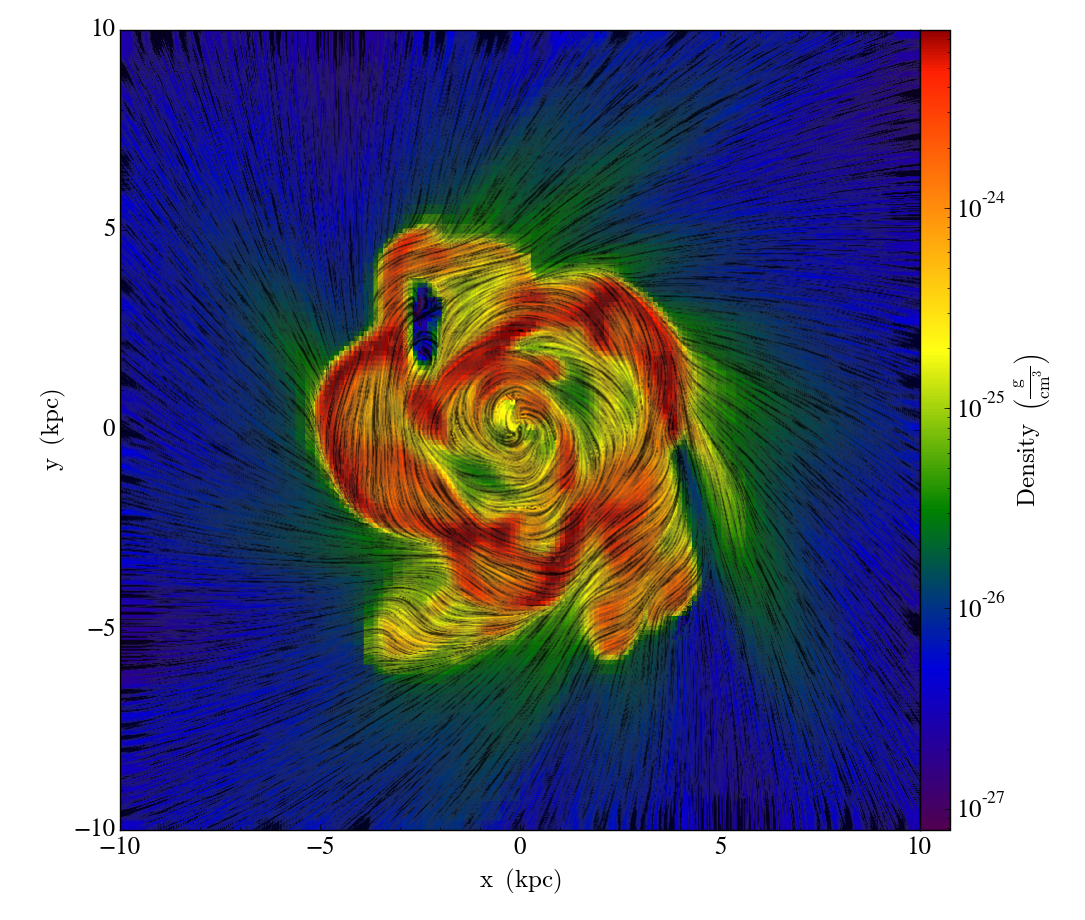
Drawing LIC for your data with yt is extremely easy – just with a single line of code:

import yt
ds = yt.load("IsolatedGalaxy/galaxy0030/galaxy0030")
s = yt.SlicePlot(ds, 'z', 'density', center='c', width=(20, 'kpc'))
s.annotate_line_integral_convolution('velocity_x', 'velocity_y',
lim=(0.5,0.65))
s.save()

Here velocity_x and velocity_y tell yt to visualize the velocity field, which is overlaid onto the original density slice plot. Adjusting lim will “squeeze” the range of LIC magnitude and change the visibility of LIC plot. The code will produce the following image:

line integral velocity

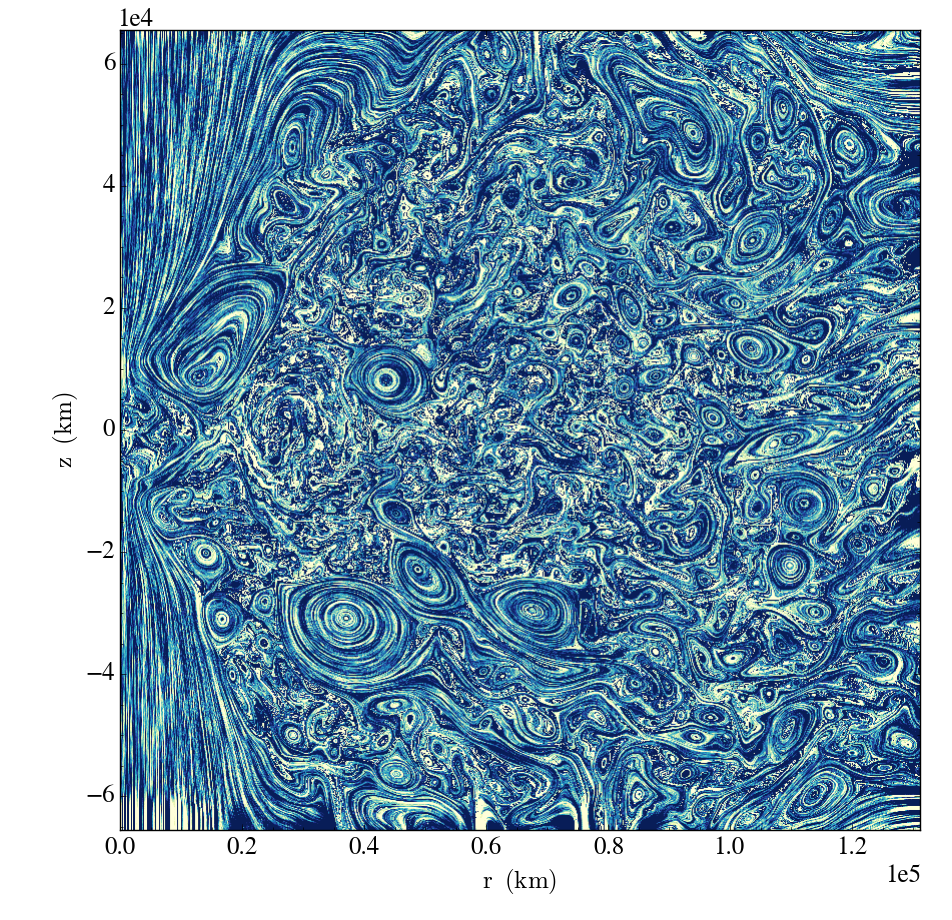
There are more parameters you can play with to generate a perfect image. For instance, although const_alpha is set to False as default to generate a semitransparent LIC image over original plot, you can also set const_alpha to True and use alpha=1 to get a pure LIC image. The following code visualizes LIC of the magnetic field in white dwarf binary simulation:

import yt
ds = yt.load("WDMerger_hdf5_chk_1000/WDMerger_hdf5_chk_1000.hdf5")
s = yt.SlicePlot(ds, 'theta', 'magnetic_field_strength', origin='native')
s.annotate_line_integral_convolution('magnetic_field_x', 'magnetic_field_y',
lim=(0.45,0.55), cmap='YlGnBu', alpha=1.,const_alpha=True)
s.hide_colorbar()
s.save()

and the following image is produced:

line integral BField

yt extension modules

yt has many extension packages to help you in your scientific workflow! Check these out, or create your own.

ytini

ytini is set of tools and tutorials for using yt as a tool inside the 3D visual effects software Houdini or a data pre-processor externally to Houdini.

Trident

Trident is a full-featured tool that projects arbitrary sightlines through astrophysical hydrodynamics simulations for generating mock spectral observations of the IGM and CGM.

pyXSIM

pyXSIM is a Python package for simulating X-ray observations from astrophysical sources.

ytree

Analyze merger tree data from multiple sources. It’s yt for merger trees!

yt_idv

yt_idv is a package for interactive volume rendering with yt! It provides interactive visualization using OpenGL for datasets loaded in yt. It is written to provide both scripting and interactive access.

widgyts

widgyts is a jupyter widgets extension for yt, backed by rust/webassembly to allow for browser-based, interactive exploration of data from yt.

yt_astro_analysis

yt_astro_analysis is the yt extension package for astrophysical analysis.

Make your own!!

Finally, check out our development docs on writing your own yt extensions!

Contributing to the Blog

Are you interested in contributing to the yt blog?

Check out our post on contributing to the blog for a guide!

We welcome contributions from all members of the yt community. Feel free to reach out if you need any help.

the yt data hub

The yt hub at https://girder.hub.yt/ has a ton of resources to check out, whether you have yt installed or not.

The collections host all sorts of data that can be loaded with yt. Some have been used in publications, and others are used as sample frontend data for yt. Maybe there’s data from your simulation software?

The rafts host the yt quickstart notebooks, where you can interact with yt in the browser, without needing to install it locally. Check out some of the other rafts too, like the widgyts release notebooks – a demo of the widgyts yt extension pacakge; or the notebooks from the CCA workshop – a user’s workshop on using yt.

Social Links