the yt project's blog
© 2021 yt project blog
© 2021 yt project blog
Do you have:
Consider contributing to the blog! Here’s how to do it!
An update and proposal on continuing development of Dask and yt.
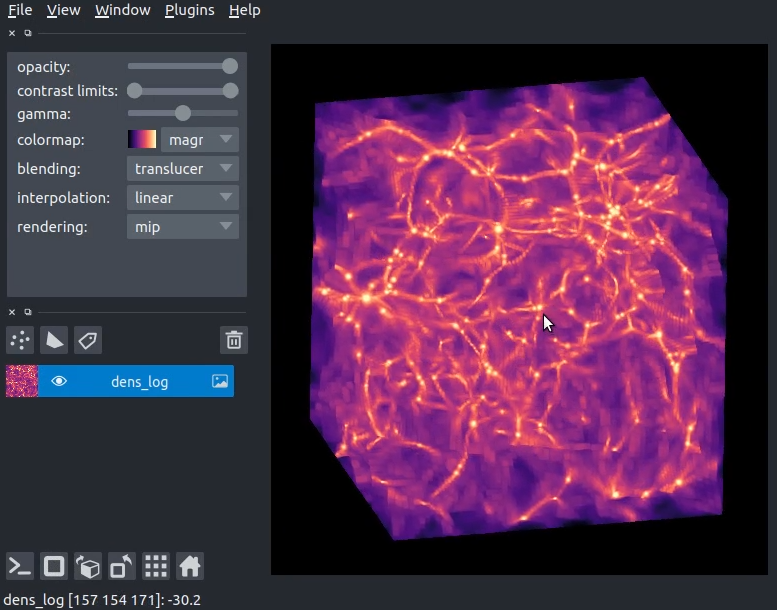
Interactive visualization of yt data using napari?
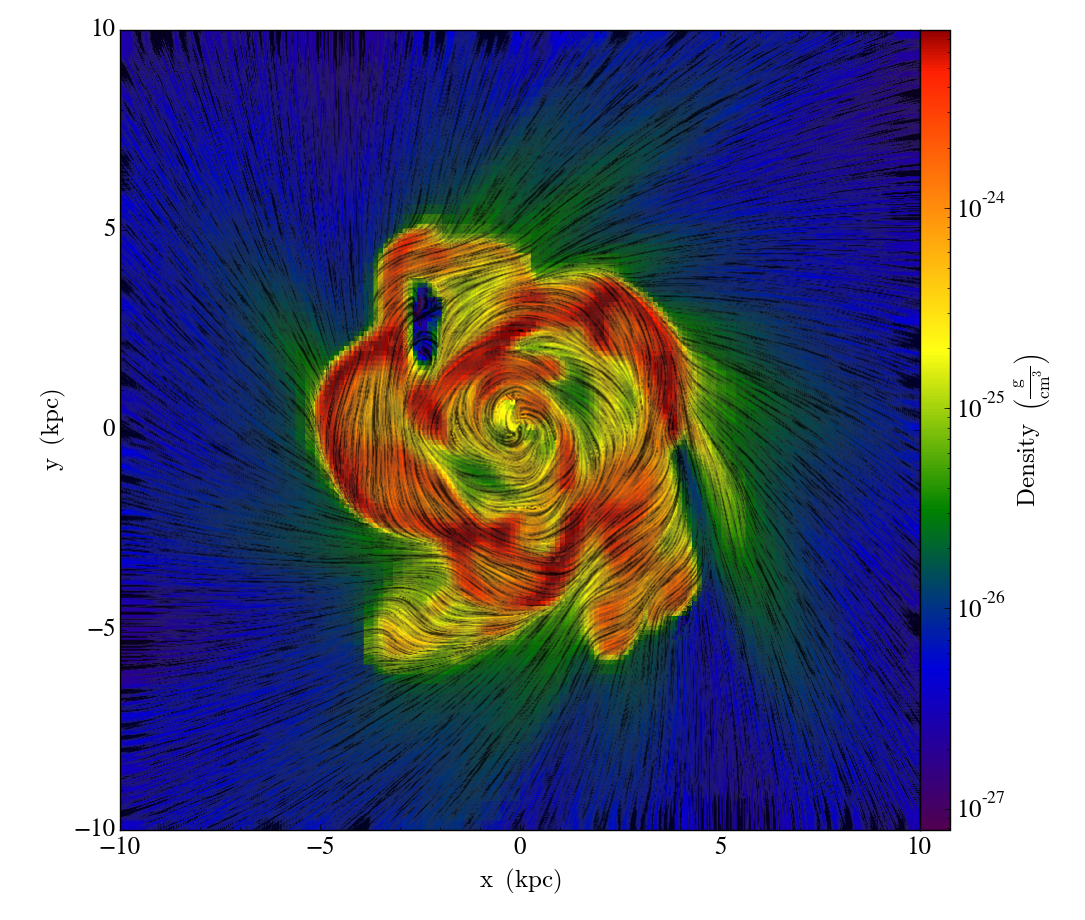
How to visualize a line integral convolution for a vector field with yt

A new post about our project’s governance!
Our reasoning for switching licenses for the yt-project

How to export surfaces into an obj file (will it blend?!)
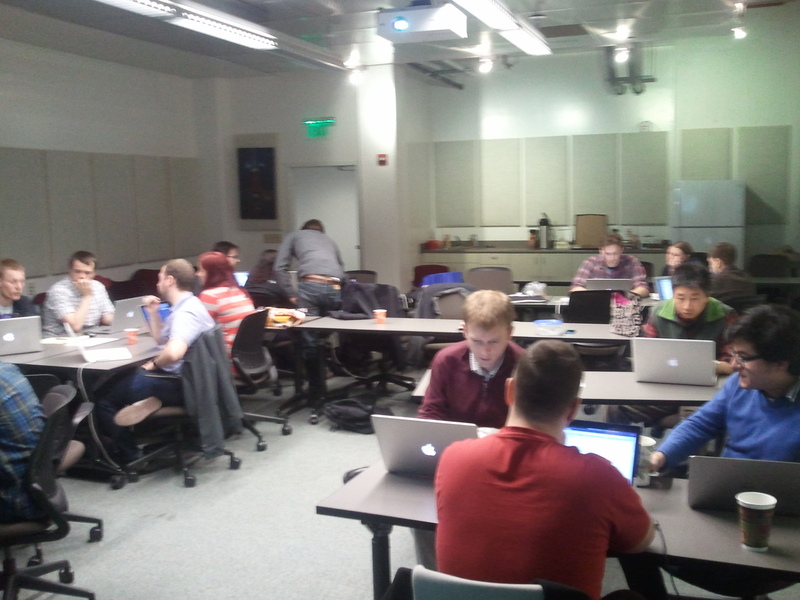
On March 6-8, 2013 we held a yt development workshop at UCSC. Let’s talk about it!

Announcing yt 2.5!
Announcing the 2013 yt developer workshop!
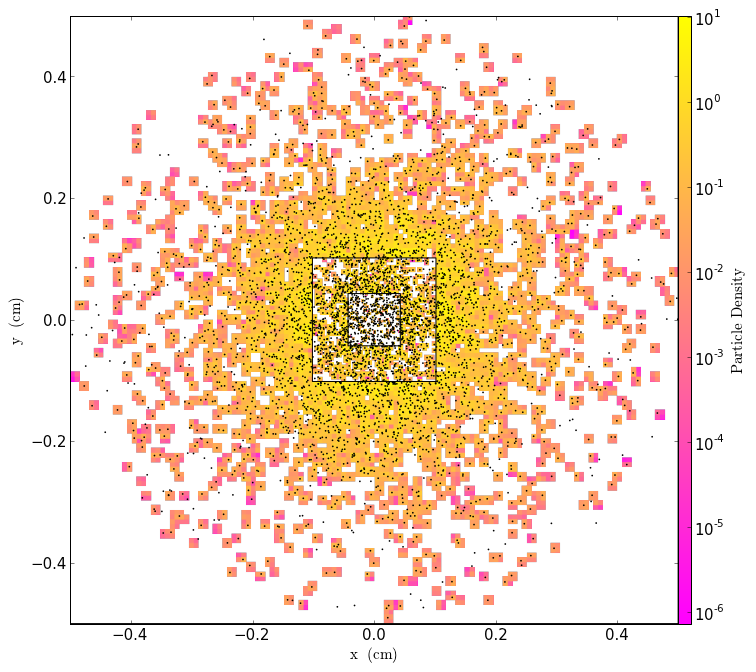
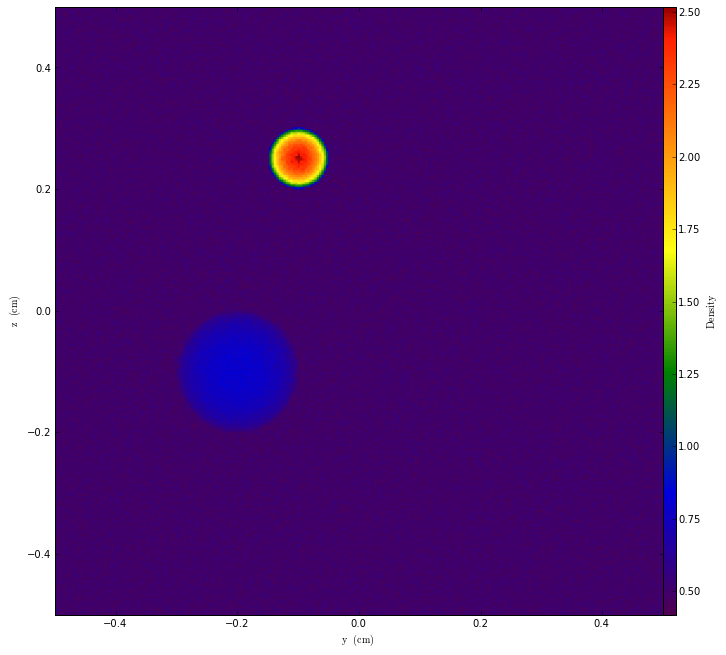
This post shows how to generate particle fields from pre-defined particle lists, lattice distributions, and distributions based on density fields.

What was 2012 like for the yt community? Let’s look back together!
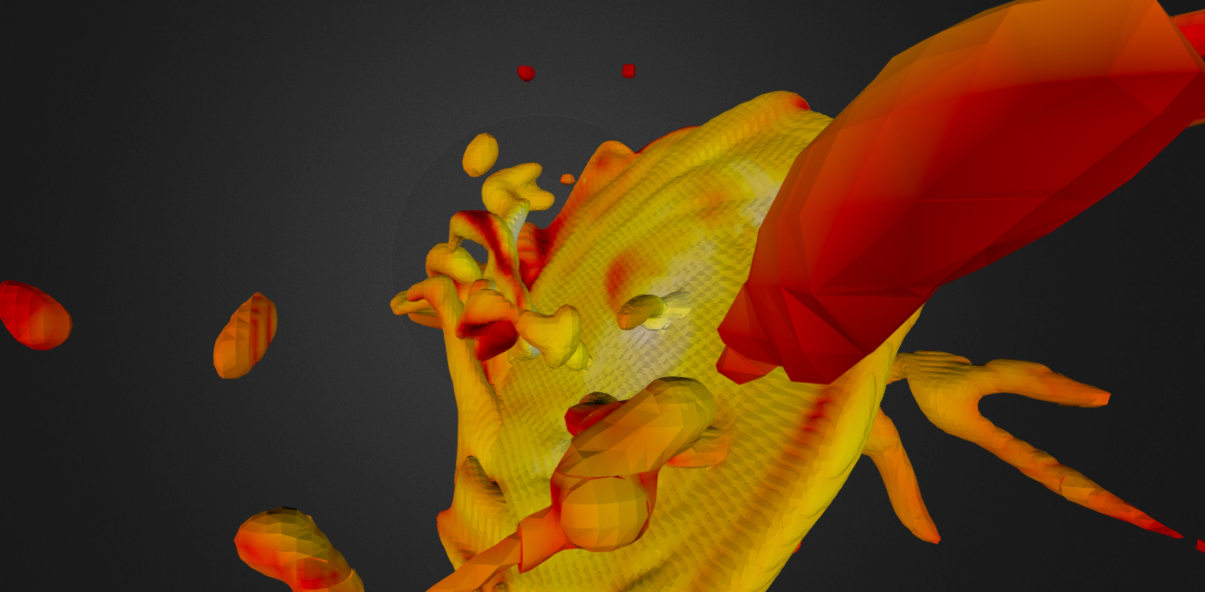
Let’s talk about exporting surfaces to sketchfab with yt!
We’ve got a new blog! Here’s a post that talks about the changes we’ve made and how we expect to move forward!

Want to contribute a post? Check out our contributor guide
Check out our documentation here
The yt-project homepage
Our quickstart notebooks on getting started
The yt source repository
yt has many extension packages to help you in your scientific workflow! Check these out, or create your own.
ytini is set of tools and tutorials for using yt as a tool inside the 3D visual effects software Houdini or a data pre-processor externally to Houdini.
Trident is a full-featured tool that projects arbitrary sightlines through astrophysical hydrodynamics simulations for generating mock spectral observations of the IGM and CGM.
pyXSIM is a Python package for simulating X-ray observations from astrophysical sources.

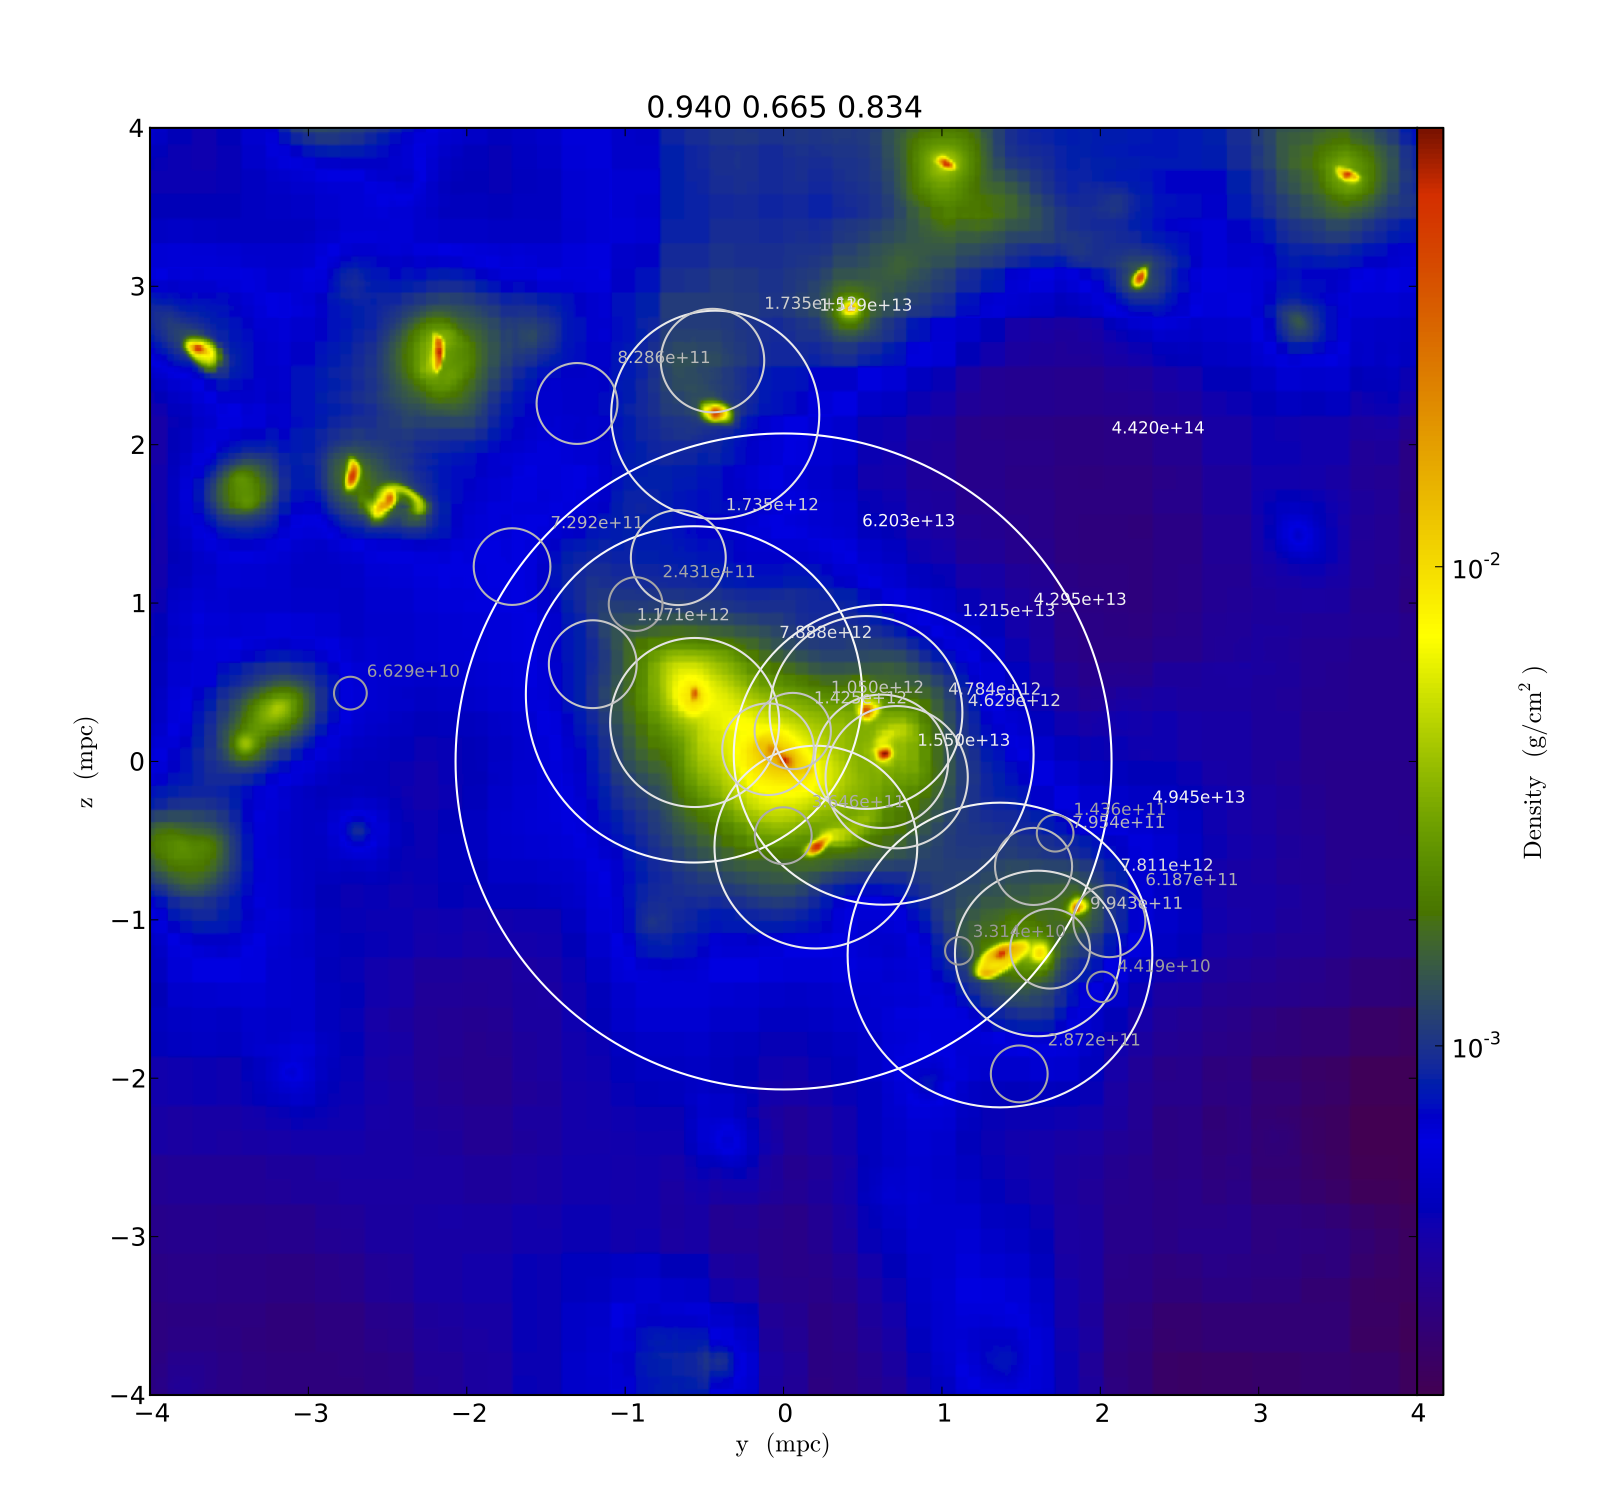
Analyze merger tree data from multiple sources. It’s yt for merger trees!

yt_idv is a package for interactive volume rendering with yt! It provides interactive visualization using OpenGL for datasets loaded in yt. It is written to provide both scripting and interactive access.
widgyts is a jupyter widgets extension for yt, backed by rust/webassembly to allow for browser-based, interactive exploration of data from yt.
yt_astro_analysis is the yt extension package for astrophysical analysis.
Finally, check out our development docs on writing your own yt extensions!
Are you interested in contributing to the yt blog?
Check out our post on contributing to the blog for a guide! https://yt-project.github.io/blog/posts/contributing/
We welcome contributions from all members of the yt community. Feel free to reach out if you need any help.
The yt hub at https://girder.hub.yt/ has a ton of resources to check out, whether you have yt installed or not.
The collections host all sorts of data that can be loaded with yt. Some have been used in publications, and others are used as sample frontend data for yt. Maybe there’s data from your simulation software?
The rafts host the yt quickstart notebooks, where you can interact with yt in the browser, without needing to install it locally. Check out some of the other rafts too, like the widgyts release notebooks – a demo of the widgyts yt extension pacakge; or the notebooks from the CCA workshop – a user’s workshop on using yt.